Museum of Tolerance Los Angeles
Social Lab Exhibit Ecosystem
HOME
ROLETechnical Lead / Programming Lead / UX + Systems Architecture / Team Lead (3 developers total)
DATE
Summer 2021 (Design + Development + COVID-era Remote Delivery)
World Today expansion added post-launch
World Today expansion added post-launch
Executive Summary
Unified Field was brought in to design and build the interactive exhibit ecosystem for the Social Lab at the Museum of Tolerance in Los Angeles.
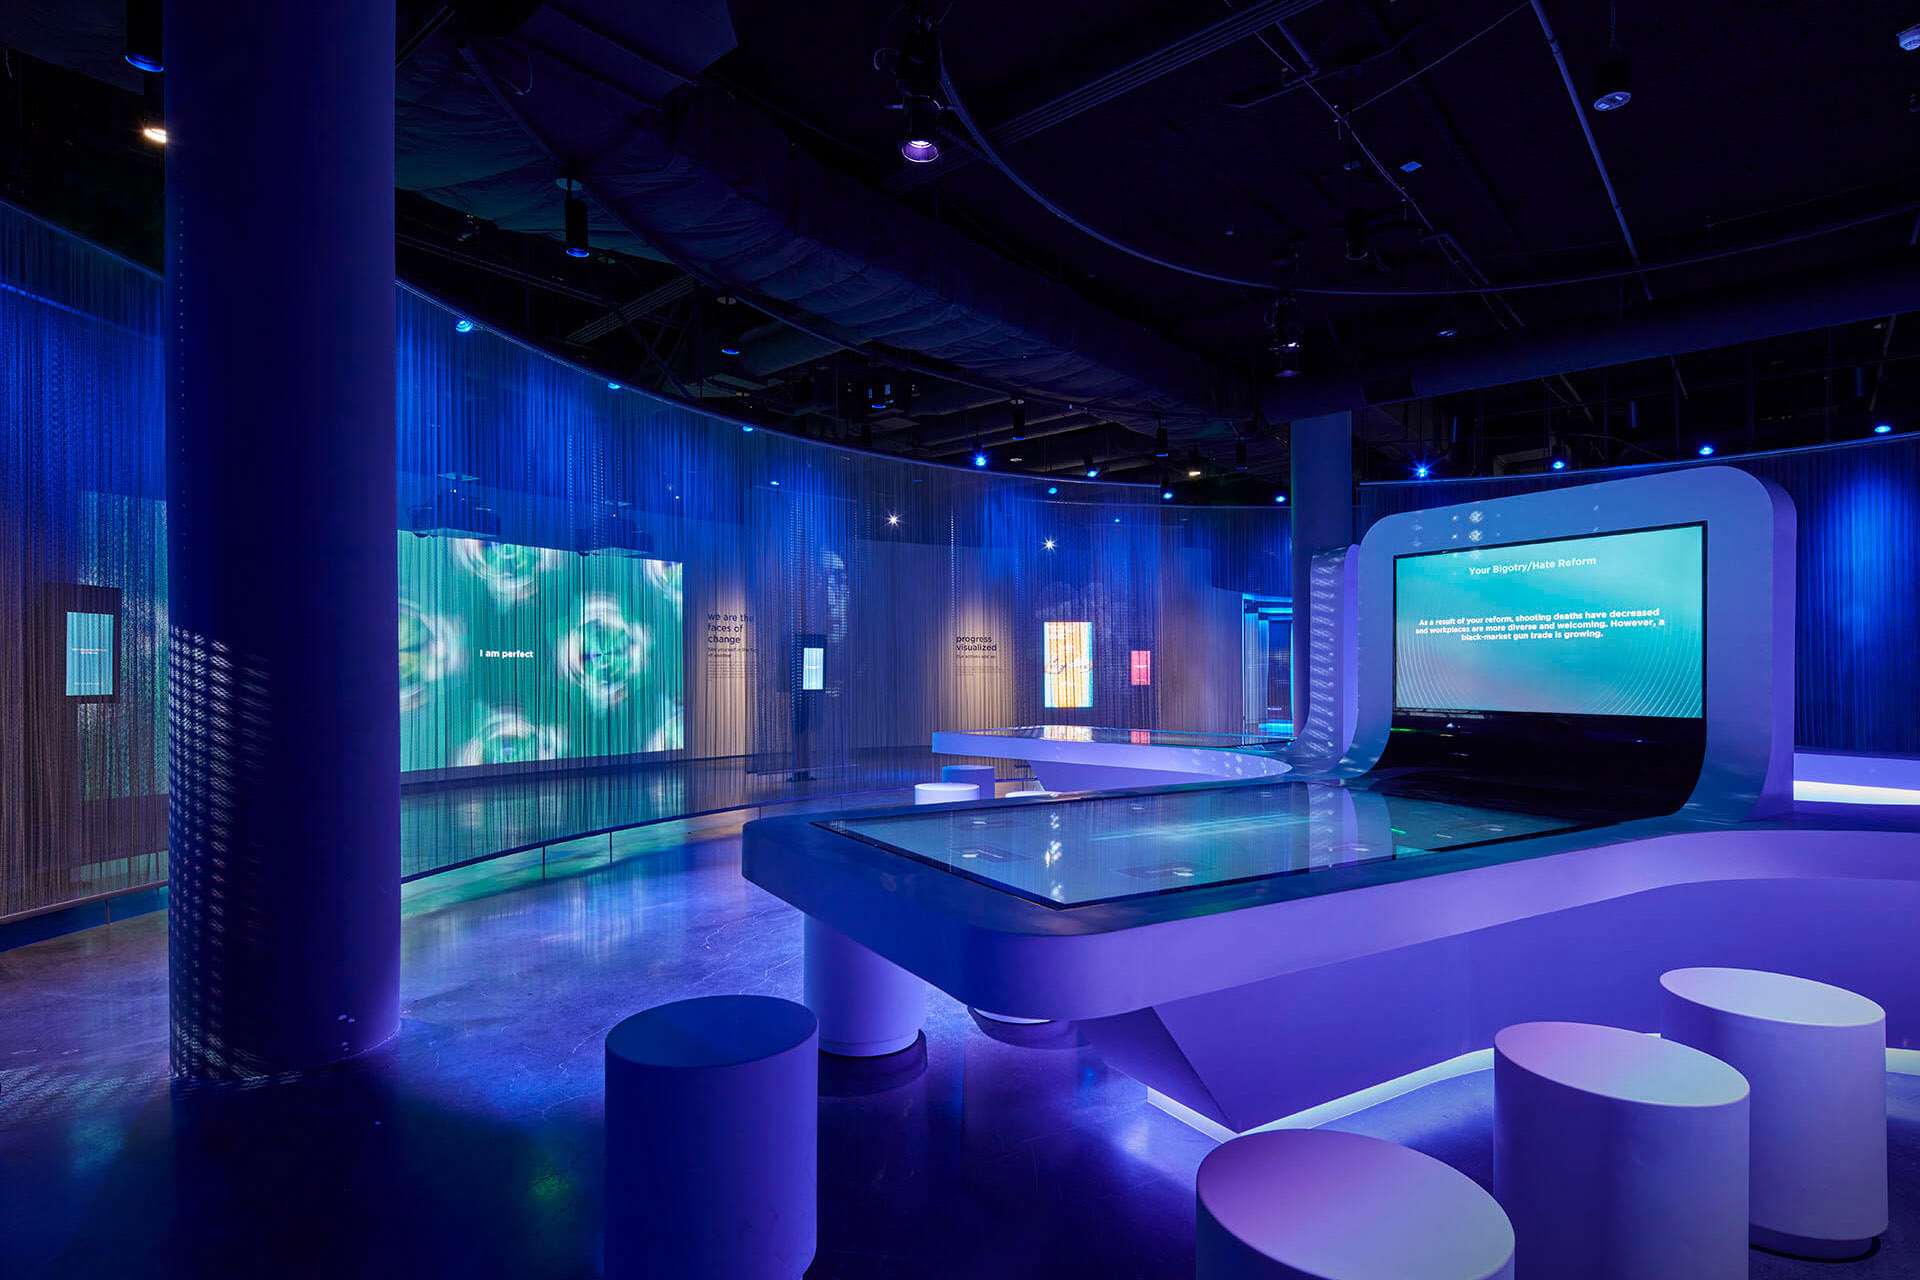
The Social Lab is a linear, guided experience made up of 16 interactive and media-driven activities, designed to encourage visitors to explore intolerance, bias, identity, and civic responsibility through personal reflection and group engagement.
I served as the technical lead and programming lead, responsible for translating exhibit concepts into deliverable systems. This included defining hardware requirements, coordinating with AV vendors, designing system architecture, and developing core software platforms used across multiple installations.
A key challenge was that this project was delivered during COVID, meaning much of the development and coordination happened remotely while still requiring tight integration with AV teams, fabrication timelines, and onsite installation realities.
The final result was a multi-exhibit ecosystem combining kiosks, projections, computer vision systems, multitouch environments, backend services, live data ingestion, and synchronized visualizations—all designed to operate reliably in a public museum environment.
The Social Lab is a linear, guided experience made up of 16 interactive and media-driven activities, designed to encourage visitors to explore intolerance, bias, identity, and civic responsibility through personal reflection and group engagement.
I served as the technical lead and programming lead, responsible for translating exhibit concepts into deliverable systems. This included defining hardware requirements, coordinating with AV vendors, designing system architecture, and developing core software platforms used across multiple installations.
A key challenge was that this project was delivered during COVID, meaning much of the development and coordination happened remotely while still requiring tight integration with AV teams, fabrication timelines, and onsite installation realities.
The final result was a multi-exhibit ecosystem combining kiosks, projections, computer vision systems, multitouch environments, backend services, live data ingestion, and synchronized visualizations—all designed to operate reliably in a public museum environment.
System Goals / Design Requirements
Operational Requirements
- Multiple exhibits must run continuously and reliably with minimal staff intervention
- Hardware specifications must be feasible within AV/vendor procurement constraints
- Exhibits must tolerate visitor misuse and unpredictable interaction patterns
- Backend services must support multi-device content distribution and data collection
- Logging and analytics must be captured for museum reporting needs (World Today)
- All systems must be installable and maintainable under real-world AV constraints
- Each exhibit must provide immediate feedback to visitors
- Group-based interactions must scale to multiple participants simultaneously
- Projection environments must support edge blending and multi-display mapping
- Computer vision installations must work under changing lighting and high traffic
- Interactive experiences must feel cohesive even though they are independent modules
Architectural Overview (Platform Model)
The Social Lab was not a single program—it was a collection of installations that shared a common infrastructure:
Exhibit Platform Components
Exhibit Platform Components
- Central backend server + database
- CMS-driven content distribution
- Multiple kiosk systems (Chromium + JavaScript)
- Multiple projection / openFrameworks applications
- Multi-PC computer vision capture utilities
- TCP-based real-time messaging between backend and displays
- Analytics + reporting export pipeline
Core Subsystems
1. Backend Server + CMS (Social Lab Core Infrastructure)
Stack: Ubuntu, Node.js, ExpressJS, PostgreSQL
I built the backend server that supported the Social Lab as a shared platform. It served content to multiple exhibits, captured visitor-generated data, and provided centralized storage for photos, analytics, and exhibit state.
Primary Responsibilities
I built the backend server that supported the Social Lab as a shared platform. It served content to multiple exhibits, captured visitor-generated data, and provided centralized storage for photos, analytics, and exhibit state.
Primary Responsibilities
- Serve CMS-managed content to kiosks and displays
- Capture visitor interaction data across multiple exhibits
- Store and serve user photos (for projection-based exhibits)
- Provide REST endpoints for kiosk applications
- Provide TCP messaging for real-time exhibit feedback loops
- Store analytics and generate exportable reporting data
2. Tolerance Lens (Kiosks + Projection Data Visualization)
Frontend Stack: Chromium + JavaScript (kiosks)
Display Stack: openFrameworks (projection wall)
Backend: Node.js + PostgreSQL
Tolerance Lens was a high-engagement exhibit combining visitor polling + photography with real-time projection feedback.
Visitor Experience
Visitors respond to a prompt such as:
"I feel represented in the media today."
They rank their response on a 1–5 scale and take a portrait photo.
Their response becomes part of a live visual display on the projection wall.
Physical / Hardware Layout
Immediate feedback loop.
A visitor needed to submit a photo and see it appear on the wall in real time.
Visual Output
The wall cycles through prompts and visualizations, displaying aggregated responses and visitor photos in a kaleidoscope-style animation system.
Display Stack: openFrameworks (projection wall)
Backend: Node.js + PostgreSQL
Tolerance Lens was a high-engagement exhibit combining visitor polling + photography with real-time projection feedback.
Visitor Experience
Visitors respond to a prompt such as:
"I feel represented in the media today."
They rank their response on a 1–5 scale and take a portrait photo.
Their response becomes part of a live visual display on the projection wall.
Physical / Hardware Layout
- 6 portrait kiosks (touch + webcam capture)
- 2 projectors (1900×1200 each, edge blended)
- Large projection wall driven by openFrameworks
- Kiosk UI captures rating + portrait photo
- Photo + data is uploaded to backend server
- Backend stores response data and image assets
- Backend dispatches a TCP notification to the projection wall
- Projection wall pulls the new image and highlights it immediately
Immediate feedback loop.
A visitor needed to submit a photo and see it appear on the wall in real time.
Visual Output
The wall cycles through prompts and visualizations, displaying aggregated responses and visitor photos in a kaleidoscope-style animation system.
3. Forum Table (Multi-Touch Group Decision Exhibit)
Stack: openFrameworks, TCP messaging, HAP video playback
Forum Table was a collaborative group exhibit designed for up to 6 participants. Visitors discussed civic issues, made tradeoff decisions, and viewed supporting “expert opinion” video content on an upright display.
Physical Layout
1. Hardware Bottleneck Constraints
The AV-specified PC had a strong GPU but a CPU with low clock speed and many cores. This created performance issues for openFrameworks’ primary draw thread.
Solution Strategies
The physical screen sagged due to insufficient structural support, causing touch inaccuracies at the edges.
My Contribution
Forum Table was a collaborative group exhibit designed for up to 6 participants. Visitors discussed civic issues, made tradeoff decisions, and viewed supporting “expert opinion” video content on an upright display.
Physical Layout
- Multi-touch table surface
- Secondary upright display for video playback
- Custom fabricated table enclosure + touch overlay
1. Hardware Bottleneck Constraints
The AV-specified PC had a strong GPU but a CPU with low clock speed and many cores. This created performance issues for openFrameworks’ primary draw thread.
Solution Strategies
- Split the system into two separate window contexts / applications (one per display)
- Used TCP communication between the two apps for synchronization
- Encoded videos using HAP, reducing CPU overhead and stabilizing playback
The physical screen sagged due to insufficient structural support, causing touch inaccuracies at the edges.
My Contribution
- Diagnosed the issue through systematic testing
- Demonstrated that software input mapping was correct
- Worked with AV/fabrication team to confirm the problem was physical, not software
4. Bias Test (Fast Reaction Kiosk)
Stack: Chromium + JavaScript
A lightweight kiosk exhibit designed to test visitor reaction time and decision patterns via swipe-left/right prompts.
A lightweight kiosk exhibit designed to test visitor reaction time and decision patterns via swipe-left/right prompts.
5. Word Projection (Computer Vision + Projection Mapping)
Computer Vision Stack: Custom utility built on CCV + Azure Kinect
Front-End Display: Unity (built by another developer)
Hardware: 4 Azure Kinects, ceiling mounted
Topology: multi-PC, multi-projector with edge blending
This was the most technically complex environment in the Social Lab from an infrastructure standpoint.
Visitor Experience
Visitors walked through a projection space where words and light reacted dynamically to crowd movement.
System Layout
Azure Kinect was not compatible with our existing CCV pipeline, so I modified and adapted CCV to support:
Scalable crowd tracking across multiple cameras without seams.
Front-End Display: Unity (built by another developer)
Hardware: 4 Azure Kinects, ceiling mounted
Topology: multi-PC, multi-projector with edge blending
This was the most technically complex environment in the Social Lab from an infrastructure standpoint.
Visitor Experience
Visitors walked through a projection space where words and light reacted dynamically to crowd movement.
System Layout
- 2 display PCs driving 4 projectors (2 each, edge blended)
- 2 dedicated vision PCs
- 4 Azure Kinects total, mounted overhead in the ceiling
- Each Kinect machine tracked blob movement and sent data to its corresponding display PC
- Architected the system topology (PC count, Kinect count, overlap strategy)
- Defined feasibility constraints and hardware requirements
- Built the Kinect computer vision utility used by the Unity display software
- Provided configuration tools to manage top-down Kinect calibration and blob detection
- Worked with AV and developers on projection blending strategies and implementation
Azure Kinect was not compatible with our existing CCV pipeline, so I modified and adapted CCV to support:
- top-down positioning calibration
- blob tracking optimized for floor detection
- overlap-friendly tracking regions
- deployable utility runtime for multiple PCs
Scalable crowd tracking across multiple cameras without seams.
6. World Today (Positive News Feed Visualization + Kiosk Exploration)
Backend: Node.js ingestion + PostgreSQL storage + analytics export
Display: openFrameworks (4K projection + portrait ticker)
Kiosks: Chromium + JavaScript
Networking: TCP broadcast for synchronized filtering state
Data Source Model
A third-party system continuously scraped hundreds of news sources, performed sentiment classification, and tagged stories by:
This display ran an animated loop that cycled through values and visualizations:
Secondary Projection (Portrait Headline Ticker)
A vertical display showing a live scrolling feed of the newest headlines, highlighting newly arriving stories in real time.
Kiosk System (8 Stations)
Visitors could browse stories directly:
A key feature was that kiosks always stayed context-aware of what the wall was currently showing.
The wall broadcast its active value/filter state via TCP, and kiosks displayed Quick Links so visitors could instantly jump into the story set currently being visualized.
Key Engineering Requirement
Live content visualization with synchronized multi-surface navigation.
Display: openFrameworks (4K projection + portrait ticker)
Kiosks: Chromium + JavaScript
Networking: TCP broadcast for synchronized filtering state
World Today was developed as a live exhibit designed to highlight the “good in the world” — a constantly updating stream of positive, high-impact news stories meant to counter the fatigue and negativity that dominates typical media feeds.
Rather than displaying a static curated playlist, the exhibit was designed as a living system that continuously ingests global news and filters it through the Museum of Tolerance’s core values. Visitors can passively absorb the content on a cinematic wall display, or actively explore the same dataset through interactive kiosks.
This installation required deep coordination between the museum and a third-party data team responsible for generating the news feed. I served as the primary technical and UX lead across all parties — defining feed requirements, validating feasibility, shaping the structure of the incoming dataset, and designing how the information could be presented in a way that felt meaningful and emotionally accessible inside a museum environment.
In addition to acting as the integration lead, I personally designed and built the full World Today software ecosystem end-to-end: backend ingestion and storage, real-time display systems, kiosk interfaces, and the networking layer that synchronized the experience across multiple surfaces.
World Today became one of the most ambitious systems in the Social Lab due to its real-time data dependency, multi-surface synchronization, and the requirement that the exhibit remain visually engaging even as the news content constantly evolved.
Rather than displaying a static curated playlist, the exhibit was designed as a living system that continuously ingests global news and filters it through the Museum of Tolerance’s core values. Visitors can passively absorb the content on a cinematic wall display, or actively explore the same dataset through interactive kiosks.
This installation required deep coordination between the museum and a third-party data team responsible for generating the news feed. I served as the primary technical and UX lead across all parties — defining feed requirements, validating feasibility, shaping the structure of the incoming dataset, and designing how the information could be presented in a way that felt meaningful and emotionally accessible inside a museum environment.
In addition to acting as the integration lead, I personally designed and built the full World Today software ecosystem end-to-end: backend ingestion and storage, real-time display systems, kiosk interfaces, and the networking layer that synchronized the experience across multiple surfaces.
World Today became one of the most ambitious systems in the Social Lab due to its real-time data dependency, multi-surface synchronization, and the requirement that the exhibit remain visually engaging even as the news content constantly evolved.
Data Source Model
A third-party system continuously scraped hundreds of news sources, performed sentiment classification, and tagged stories by:
- museum values (9 values)
- humanitarian topics (30+)
- people, organizations, interests
- geo coordinates (when available)
- impact score
- summaries + links
- Subscribe to the incoming feed (GCP-based delivery)
- Parse and normalize incoming stories
- Insert/update database records
- Notify displays of new headlines (TCP)
- Provide endpoints for kiosks and projections to query content
- Capture analytics:
- story opens
- story emails
- filter interactions
- Export daily analytics payloads to an external endpoint
This display ran an animated loop that cycled through values and visualizations:
- value introduction screen
- word cloud of trending terms
- trending people + headline association
- trending organizations + headlines
- trending interests + headlines
- globe view showing high-impact stories by location
Secondary Projection (Portrait Headline Ticker)
A vertical display showing a live scrolling feed of the newest headlines, highlighting newly arriving stories in real time.
Kiosk System (8 Stations)
Visitors could browse stories directly:
- filter by value
- filter further by people / organizations / interests
- view summaries + links
- email stories to themselves
A key feature was that kiosks always stayed context-aware of what the wall was currently showing.
The wall broadcast its active value/filter state via TCP, and kiosks displayed Quick Links so visitors could instantly jump into the story set currently being visualized.
Key Engineering Requirement
Live content visualization with synchronized multi-surface navigation.
Projection Blending + Multi-Display Engineering
Several exhibits required projection blending and non-standard output mapping across different rendering environments.
Depending on the platform, I designed and validated multiple rendering strategies including:
Because the exhibit suite included openFrameworks, Unity, and Chromium-based applications, I worked closely with the AV vendor to ensure the hardware and blending tools matched the capabilities and limitations of each runtime (OpenGL vs DirectX vs browser rendering).
A major responsibility was ensuring these solutions were technically feasible and implementable by other developers on my team.
Depending on the platform, I designed and validated multiple rendering strategies including:
- frame buffer workflows (FBO-based render regions in openFrameworks)
- duplicated render passes for overlap zones
- custom viewport/output mapping for AV edge-blending pipelines
- browser-based canvas rendering adaptations to support blending software constraints
Because the exhibit suite included openFrameworks, Unity, and Chromium-based applications, I worked closely with the AV vendor to ensure the hardware and blending tools matched the capabilities and limitations of each runtime (OpenGL vs DirectX vs browser rendering).
A major responsibility was ensuring these solutions were technically feasible and implementable by other developers on my team.
Team Leadership / Project Role
This project required more than programming—it required translating museum intent into systems that could actually ship.
Responsibilities
Making exhibit delivery predictable under changing scope, vendor constraints, and installation realities.
Responsibilities
- Managed a small development team (2 additional engineers)
- Provided technical leadership and requirements definition during weekly client and AV vendor meetings.
- Defined hardware requirements and reviewed equipment lists
- Provided feasibility validation for exhibit concepts
- Assigned exhibits to developers based on skillset and schedule
- Provided technical direction and implementation oversight
- Supported AV integration, installation, and troubleshooting
- Design contributor for UX and screen layouts for multiple exhibits (especially World Today)
Making exhibit delivery predictable under changing scope, vendor constraints, and installation realities.
Skills Demonstrated
- Technical leadership for multi-exhibit museum environments
- Hardware + AV integration planning
- Node.js backend architecture (Express + Postgres)
- Real-time exhibit messaging via TCP
- openFrameworks development for large-scale projection systems
- Chromium kiosk development (JavaScript)
- Computer vision pipeline adaptation (Azure Kinect + blob detection)
- Projection blending + multi-display rendering workflows
- Performance tuning and video encoding optimization (HAP)
- Cross-team coordination with AV vendors and museum stakeholders
Tech Stack Summary
Backend: Ubuntu, Node.js, ExpressJS, PostgreSQL
Kiosks: Chromium + JavaScript
Projections / Displays: openFrameworks
Computer Vision: Azure Kinect, CCV (custom modified pipeline)
Video Optimization: HAP encoding
Networking: TCP messaging between backend, kiosks, and displays
Deployment: Multi-PC installation environments + AV vendor integration
Kiosks: Chromium + JavaScript
Projections / Displays: openFrameworks
Computer Vision: Azure Kinect, CCV (custom modified pipeline)
Video Optimization: HAP encoding
Networking: TCP messaging between backend, kiosks, and displays
Deployment: Multi-PC installation environments + AV vendor integration